- +1 800 433 4609
- |
- Request Info
- |
- Login
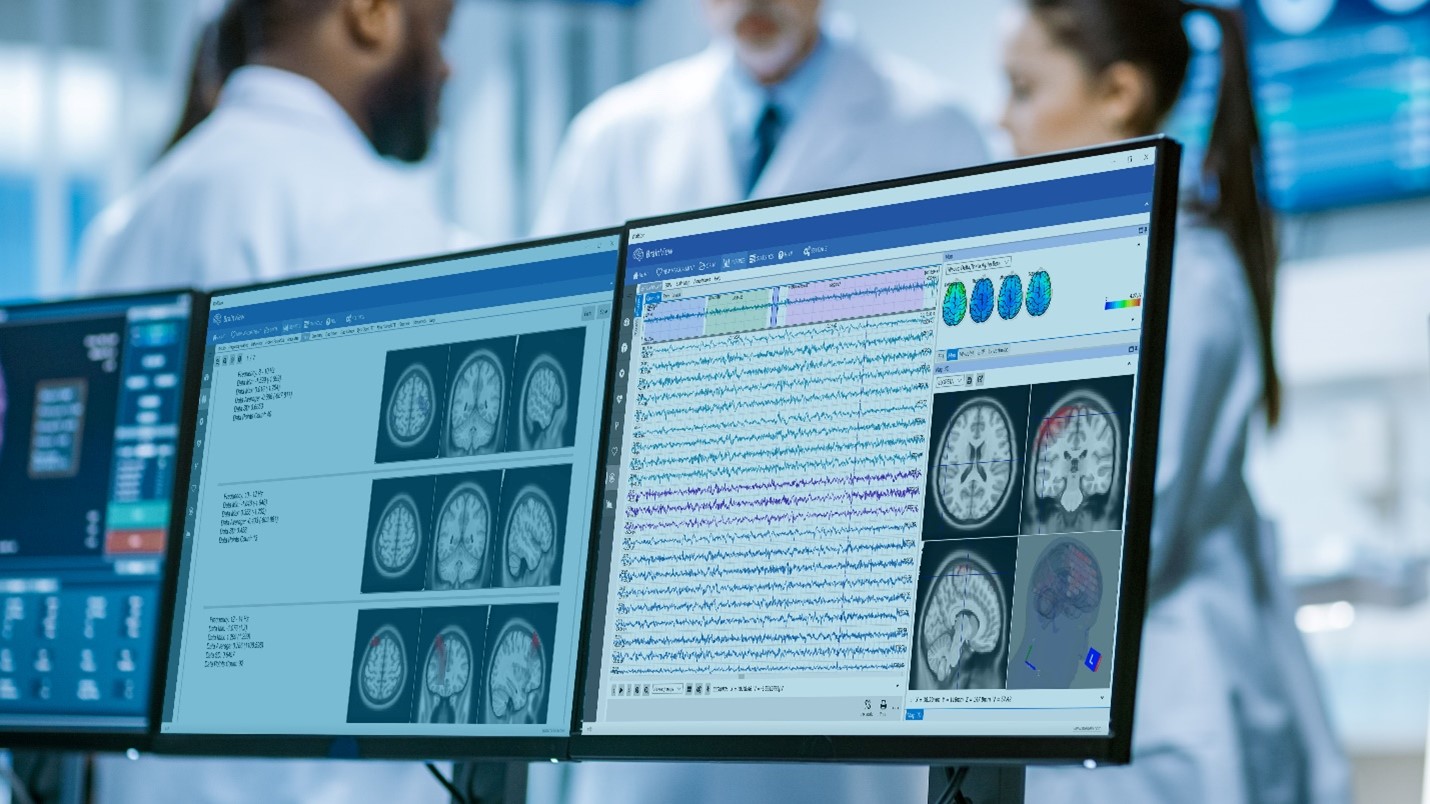
Source Analysis - 3D Brain Mapping
Source analysis is a new method for localizing the electrical activity in the brain based on scalp potentials from multiple-channel EEG recording. This revolutionary technique was called LORETA, standing for low-resolution brain electromagnetic tomography, and can be understood as an EEG-based neuro-imagining technique. LORETA transform surface EEG data into a three-dimensional distribution of electric neuronal activity in the grey matter.
We attempt to bridge the gap between surface EEG data and the respective neural source generators: EEG dynamics reflect the collective action (superposition) of many neuronal systems distributed across the brain with EEG source analysis. Source analysis disentangles the different neuronal sources and hints where and when it happened. Information pathways in the brain can be studied using either the reconstructed activation waveforms or time-frequency analysis. Source analysis can identify the brain regions involved in different tasks and depend on data quality and model quality, yield a precise localization of the generators in both space and time.
What is Low-Resolution Electromagnetic Tomography (LORETA)?
Neuro-imagining techniques aim to represent the structure or functioning of the brain. They can be understood as an X-ray photograph of the brain that, in the case of functional imagining, will show the brain areas activated during a process or cognitive task, and techniques such as EEG or MEG are examples.
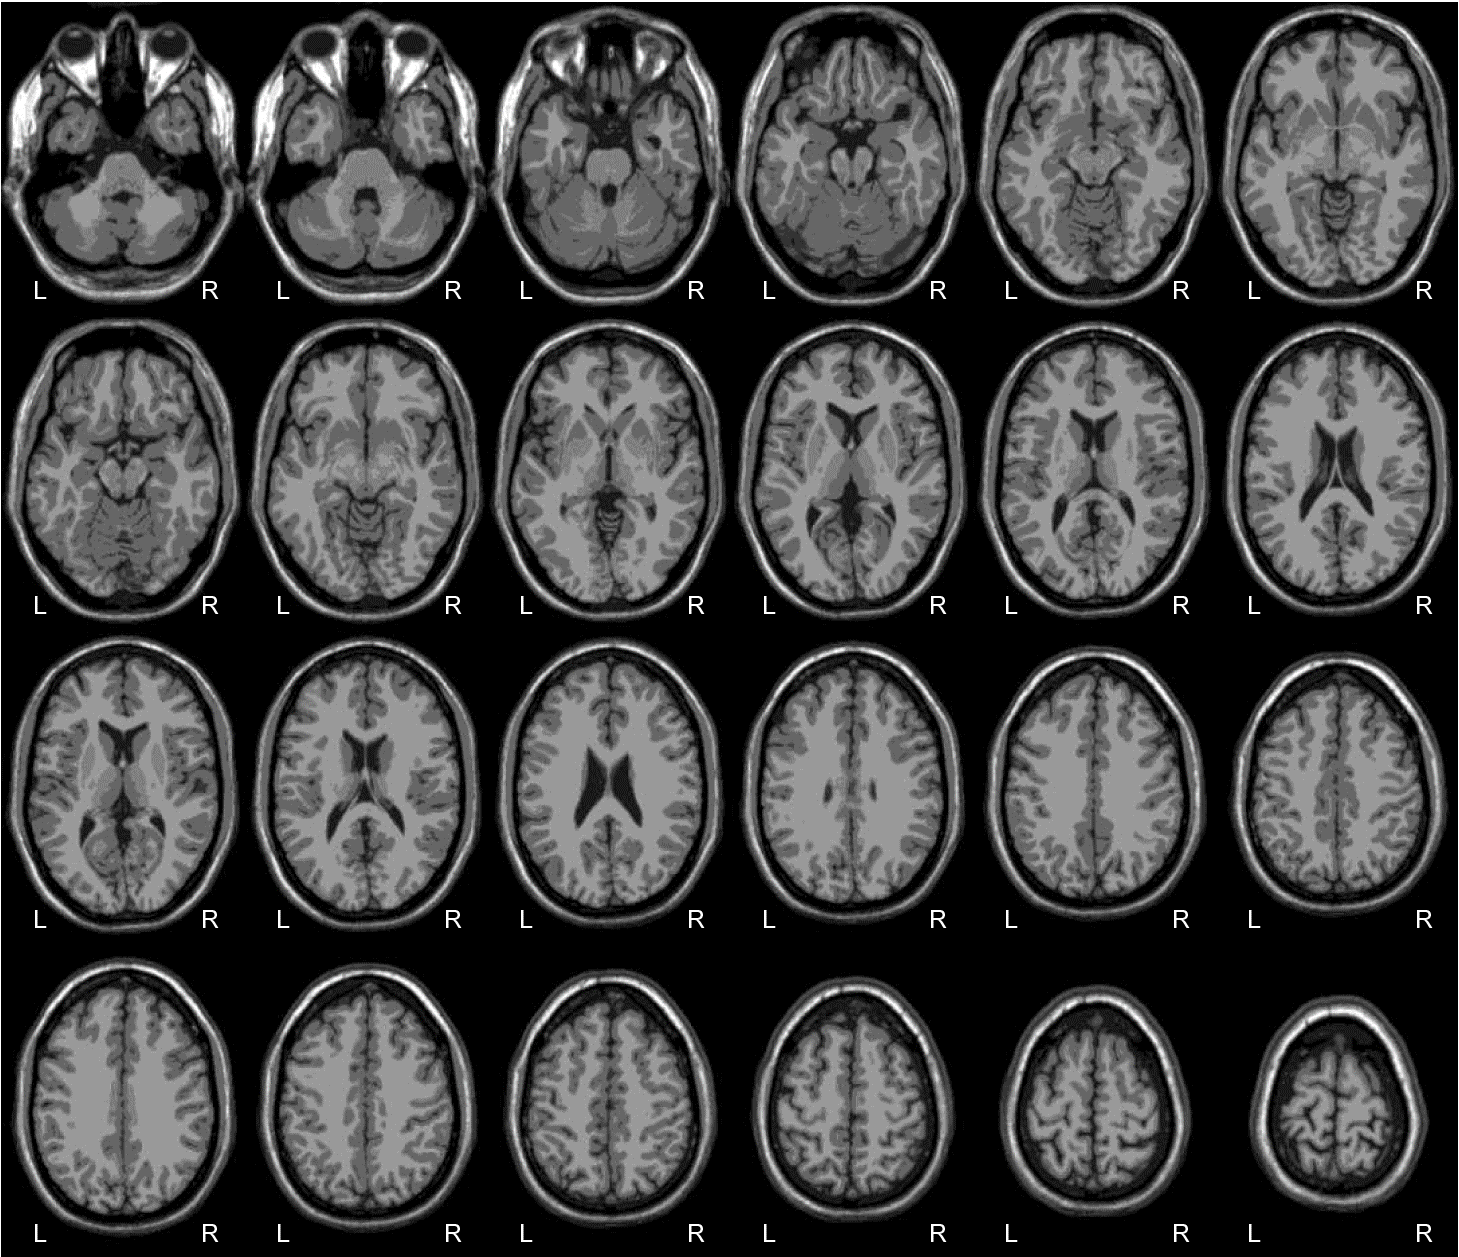
Pascual-Marqui, Michel, and Lehman published in 1994 a new method for localizing the electrical activity in the brain based on scalp potentials from multiple-channel EEG recording. This method solves the inverse problem: convert measurements into information about a physical object or system observed. This revolutionary technique was called LORETA, standing for low-resolution brain electromagnetic tomography, and can be understood as an EEG-based neuro-imagining technique. LORETA computes a three-dimensional distribution of 2400 voxels of 10x10x10mm, generating electric neuronal activity in the grey matter. A significant advantage of this technique is that it is not restricted to a certain number of electrodes or electrode locations. Therefore, it self-adapts to almost every electrode set-up and EEG measuring device.
Neuro-imagining techniques aim to represent the structure or functioning of the brain. They can be understood as an X-ray photograph of the brain that, in the case of functional imagining, will show the brain areas activated during a process or cognitive task, and techniques such as EEG or MEG are examples.
Pascual-Marqui, Michel, and Lehman published in 1994 a new method for localizing the electrical activity in the brain based on scalp potentials from multiple-channel EEG recording. This method solves the inverse problem: convert measurements into information about a physical object or system observed. This revolutionary technique was called LORETA, standing for low-resolution brain electromagnetic tomography, and can be understood as an EEG-based neuro-imagining technique. LORETA computes a three-dimensional distribution of 2400 voxels of 10x10x10mm, generating electric neuronal activity in the grey matter. A significant advantage of this technique is that it is not restricted to a certain number of electrodes or electrode locations. Therefore, it self-adapts to almost every electrode set-up and EEG measuring device.
- sLORETA: standardized low-resolution brain electromagnetic tomography (Pascual-Marqui, 2002). It has no localization bias in the presence of measurement and biological noise.
- eLORETA: fast low-resolution brain electromagnetic tomography (Pacual-Marqui 2005). The first-ever 3D, discrete, distributed, a linear solution to the inverse problem of EEG/MEG with exact localization (zero localization error).
Scalp EEG activity shows oscillations at a variety of frequencies. This rhythmic activity divides into frequency bands, and the most commonly known bands are delta, theta, alpha, beta, and gamma. EEG frequency bands have been noted to have particular biological significance and are associated with different brain functioning states. There are still uncertainties about exactly where various frequencies are generated. However, on the contrary, there is substantial knowledge about the activated areas within the brain that generate specific spectral activity along the scalp. LORETA analysis of particular frequency bands can determine which brain regions are activated during different states or mental tasks, helping determine if the brain operates in an optimal way.
LORETA voxels are located in fixed positions within the brain's grey matter. It is always important to able to analyze the activation on single voxels and entire regions associated with specific brain functionalities, and Brodmann areas. Broadman areas are regions of the cerebral cortex that were defined at the beginning of the 20th century based on their cell organization. They were proven directly related to specific brain activities such as audition, vision, and motor functionalities.
LORETA is now a well-extended EEG analysis technique used worldwide. Its versatility, and the fact that the number of EEG channels and channel location is not fixed, make it possible to use this technique with almost every EEG sensor and experimental set-up. Furthermore, the possibility of studying both simultaneously as the voltage measured at the scalp surface and the 3D distribution of the generating electric neuronal activity.
Quantitative LORETA
Quantitative LORETA (qLORETA) processes the patient's digital 3D LORETA brain activity and statistically analyzed and compared to normative database reference values in order to provide insight into differential diagnoses and effects of treatment. The processed qLORETA is commonly converted into 3d brain maps of brain functioning called "Brain Source Analysis". The qLORETA information derived can be interpreted and used by physicians as a clinical tool to deep and more accurate evaluate brain activity and function. Our normative database includes more than 40,000 healthy subjects and large patient groups with ADHD, TBI, PTSD, Alzheimer's disease, and Depression.
Quantitative LORETA (qLORETA) processes the patient's digital 3D LORETA brain activity and statistically analyzed and compared to normative database reference values in order to provide insight into differential diagnoses and effects of treatment. The processed qLORETA is commonly converted into 3d brain maps of brain functioning called "Brain Source Analysis". The qLORETA information derived can be interpreted and used by physicians as a clinical tool to deep and more accurate evaluate brain activity and function. Our normative database includes more than 40,000 healthy subjects and large patient groups with ADHD, TBI, PTSD, Alzheimer's disease, and Depression.
BrainView Products
- Neuro Cognitive
- BrainView NeuralScan Pro
- Routine Clinical EEG
- BrainView EEG-21 Pro
- BrainView EEG-64 Pro+
- BrainView EEG Software
- Long-Term EEG Monitoring
- NeuroTrace Wireless EEG/PSG
- NeuroTrace Live Panel
- NeuroFeedback
- BrainView NeuroFeedback
- Cardiovascular
- VitalScan ANS +
- VitalScan SudoCheck +
- VitalScan Vascular +